Intuition and Formalism: the Isoperimetric inequality
In this post, I want to illustrate what mathematical intuition is, and how it relates to the logical, symbolic, and calculation-based mathematics most people are familiar with. The point I want to argue is that the heart of doing mathematics is about (1) exercising our imagination to develop new intuitions, and (2) persistently clarifying these intuitions until we can pin them down precisely.
I think this is illustrated well by the following puzzle, which I invite you to try. Even though the puzzle might seem simple and pointless, the path it takes us down (as we’ll see) leads to very deep mathematics which is both beautiful and widely applicable.
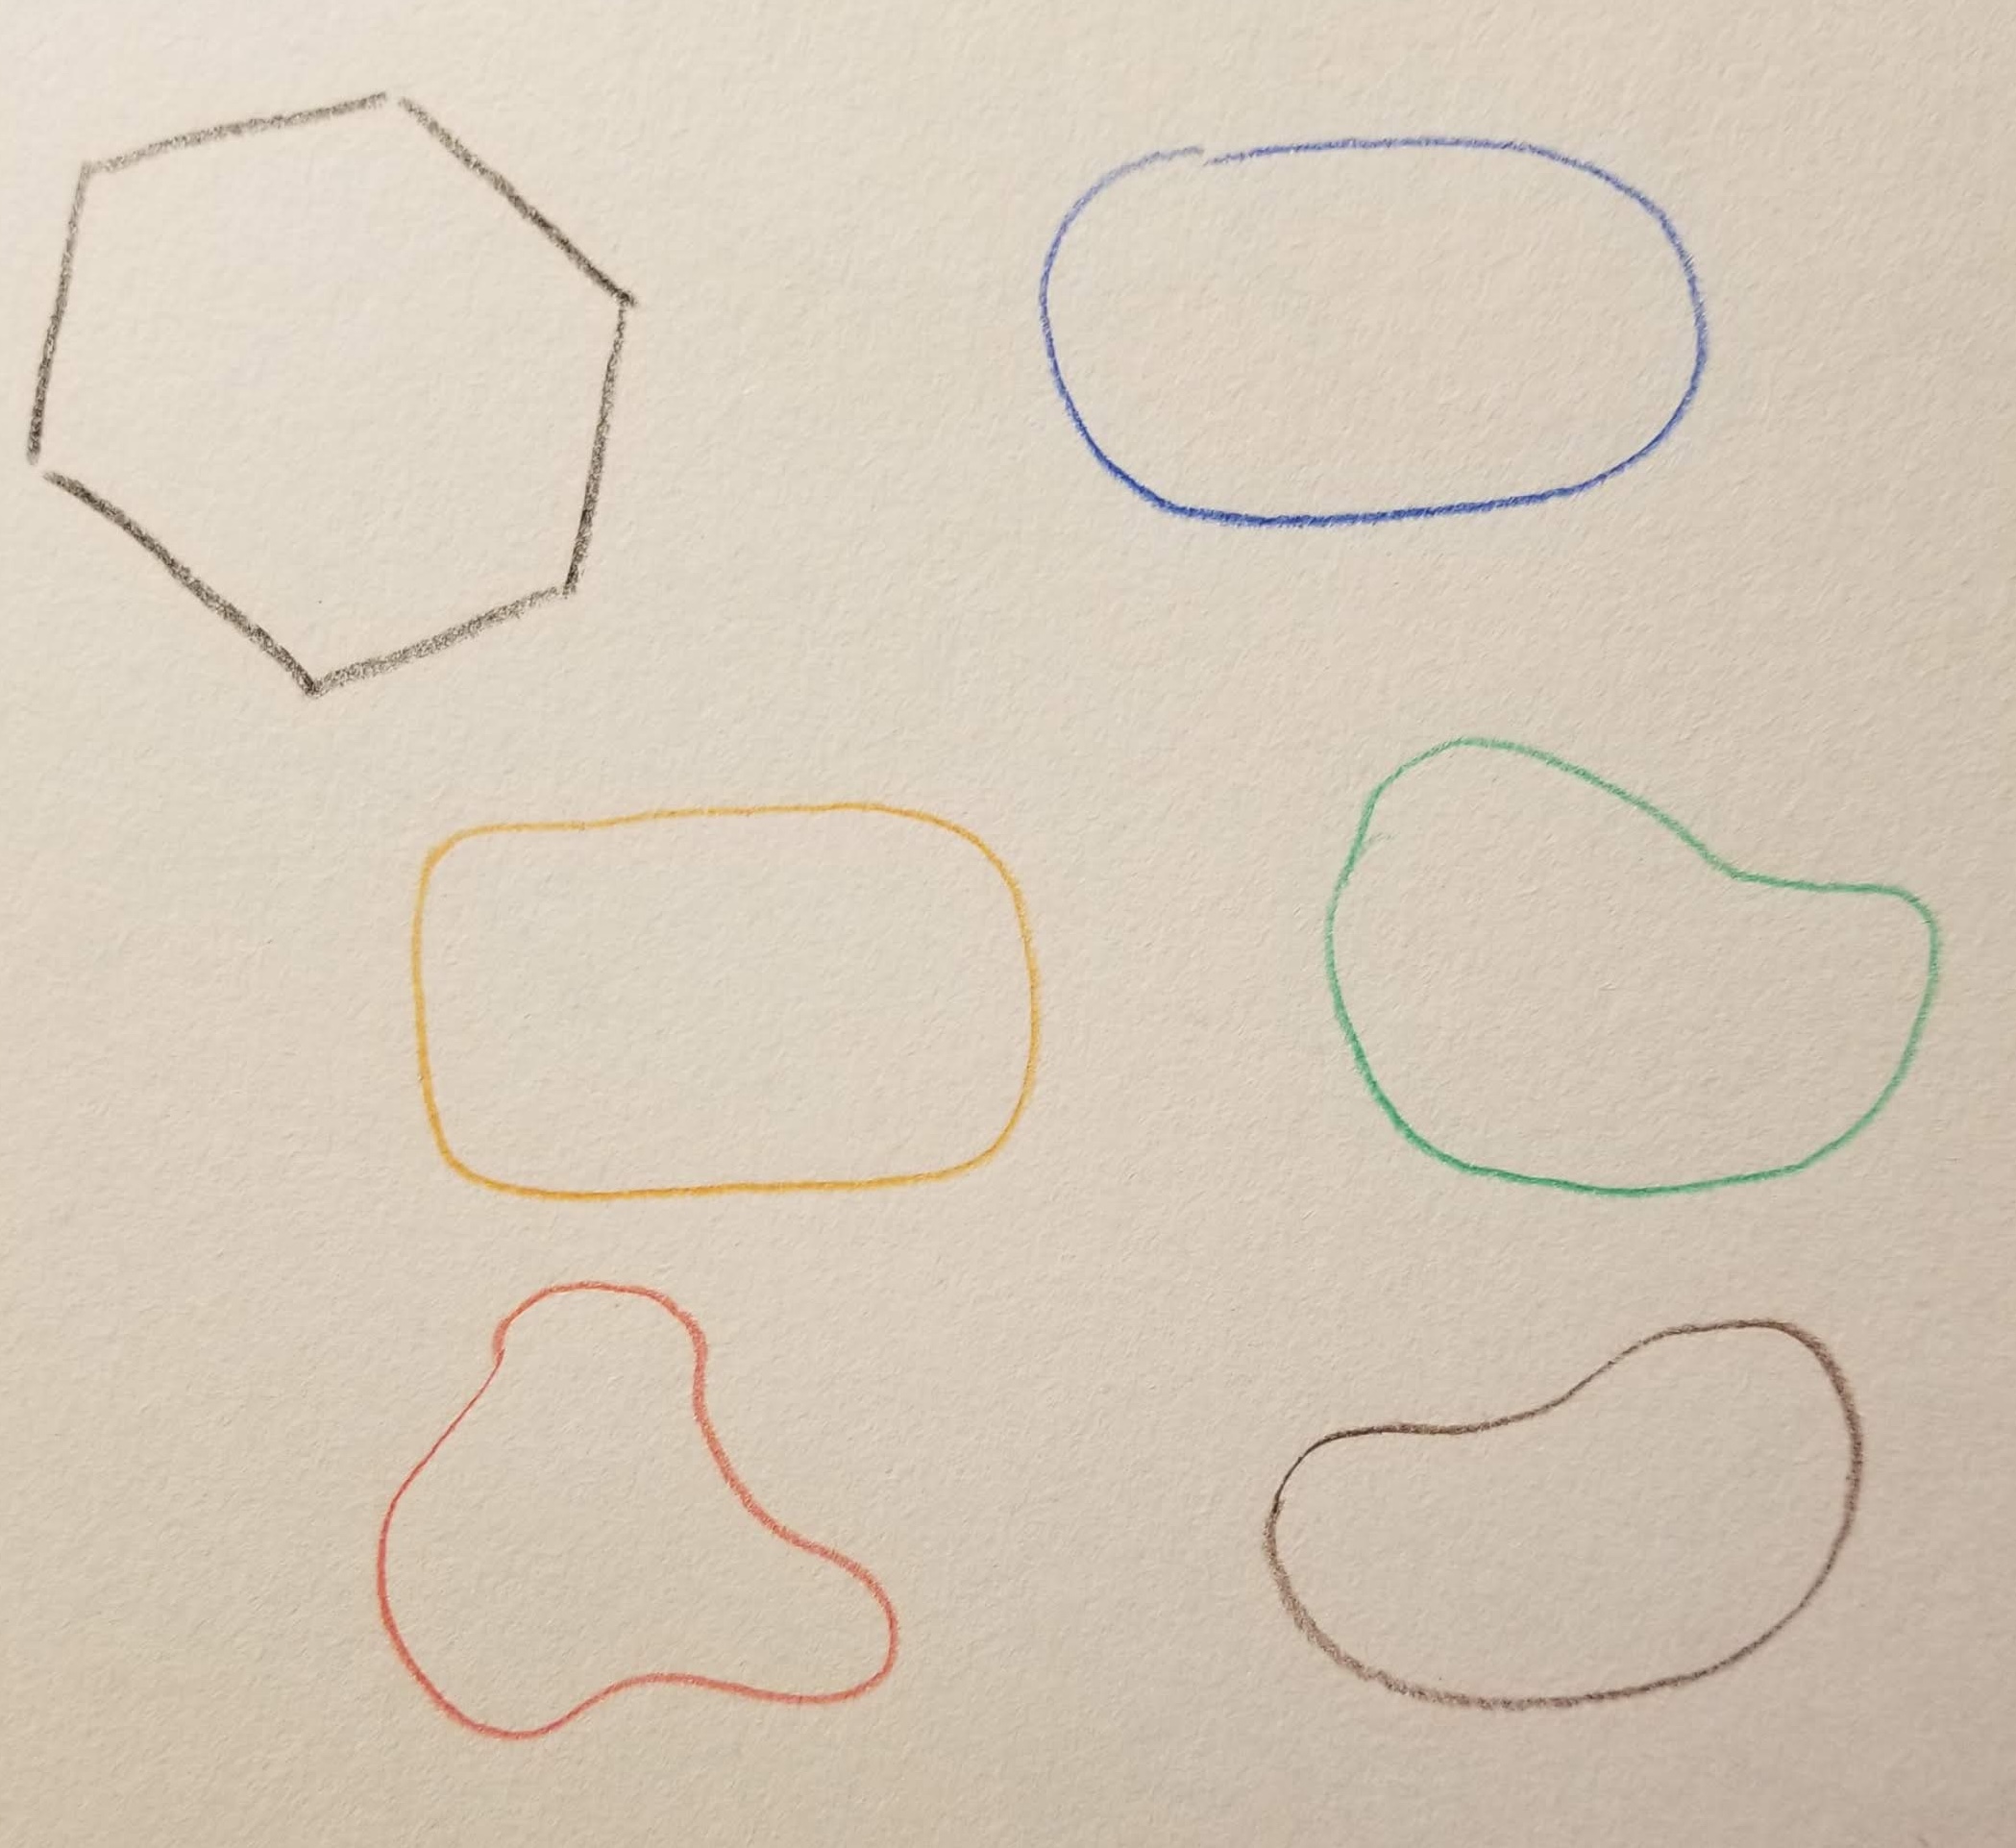
Suppose you’re given a closed loop of string, placed on a flat surface. You can deform rearrange and squish the loop however you want, but you can’t stretch the string — i.e., the total length is fixed. Your goal is to make the curve enclosed the largest possible area.
Question 1: What shape would you contort the string into?
Question 2: Can you explain to someone why you thought to pick this shape? The goal at this stage is not to make a convincing argument, but merely to describe the intuition behind your answer. What words would you say, and what gestures or movements would you use? Would you draw a picture, or demonstrate with an actual string?
Question 3: Now that you’ve done this, can you construct a precise and airtight written argument?
Before I continue on, I want you to actually try the steps above. First think of what shape pops into your head — then try to talk through how you’d justify it — then see if you can actually write that justification down.
On mathematical intuition
I recently read the book Mathematica, by David Bessis. One of book’s core theses is that doing mathematics is not about following logical steps, but about building new intuitions. A hundred-page paper in a subject will present as a wall of symbols to one person, and as light reading to another. That’s a function of whether you have an intuition for the meaning behind the formalism — and that intuition is usually embodied in visual images and physical sensations, rather than logic. The primary “source” of any new mathematical theorem is a clear internal mental model. Once you have the right picture in place, the formal mathematics writes itself.
His description of doing mathematics agrees with my own experience. I distinctly remember an experience from my fourth year of graduate school. I caught myself explaining concepts from homotopy theory to first-year students, and I was surprised at how natural it felt — though I was using technical language, it felt like I was looking at a clear picture in my head, and simply using the best language I could find to try to describe it. I imagine this is how fiction writers do it — the first step is to construct the world clearly in your own mind, and then you simply narrate what you see as you take a tour through it.
While I in some sense “knew” this about my own experience with mathematics, I’d never explicitly pieced it together until now. Seeing it articulated so clearly and explicitly has made a big difference in how I teach mathematics. Rather than trying to get students to follow the logical flow of a mathematical argument, I try to operate directly on their mental models of mathematics by sharing my own — and pushing them to build their own.
The Isoperimetric Inequality
Let’s return to the question I posed at the start of the essay. This example came to mind as I was reading Bessis’s book, because the starting premise of the puzzle (shapes) is something everybody has intuitions about, yet justifying the answer is hard — it was not done to a modern standard of rigor until the 1800s. Doing so involves ideas from the calculus of variations, which would ordinarily be considered beyond a high-school curriculum.1 The jump from intuition to proof is mostly an exercise in persistently clarifying your core intuitions until they are precise.
I’ve asked this puzzle to several friends. Everyone immediately, without thinking, said the answer is a circle. It might even seem so intuitive as to be obvious. Sometimes intuitions are wrong, but in this case there’s no funny business — the answer is indeed a circle.
So why a circle? I got a variety of answers here. One friend tried to think of describing all possible curves, but quickly realized that there are too many options. Once you start pushing around a string on a table, you realize that the space of possibilities is not just infinite, but infinite-dimensional: there are infinitely many degrees of freedom. But we still feel that a circle is the best. Another said that more oblique objects have less area, and a circle is the opposite of that. After pushing on this idea, we decided that it’s best if the “curvature” is the same everywhere, but we couldn’t justify why. With some prodding, we could refine this to the following algorithm:
If there’s one part of the curve which is sharper than the rest of the curve, you can squish that part inward and push the flatter parts of the curve outward, and this increases the area. If there are any parts of the curve which point inwards, you can push those out first.
That still requires justification, not just why it works but to even be precise. What does “sharper” mean? What’s “curvature”? How do you define “push outward/inward”, when pushing any part of the curve affects all of the other parts at the same time? And why does this process increase the area? Question 3 is about answering these questions.
Let’s start by stating the problem in a more formulaic way. The theorem that a circle maximizes the curve area for a given fixed perimeter is known as the isoperimetric inequality. Stated another way, it says that if is the length of the string, and is the area it encloses, then
and this inequality becomes an equality if and only if the curve is a circle.
The first proofs we know of which are rigorous by modern standards arose in the 1800s, despite the fact that this question has been considered for thousands of years. Today, there are multiple known rigorous proofs, but all of them — if you include the mathematical infrastructure they rest upon — are far longer than the italicized text above. Yet the italicized text above is the core idea in one possible proof. (If you want more details and history, I highly recommend this survey paper by Osserman.)
I am reminded of Thurston’s essay On Proof and Progress in Mathematics, specifically the section on page 6 where he talks about the large expansion factor between face-to-face mathematical communication (where people use gestures, draw pictures, make sound effects, and direct focus to the key points of the matter) and papers (where writers translate their ideas into flat symbols and logic, and the reader must translate back).
Why formalize at all?
I’ve been arguing that explanation of mathematics should lead with intuition, not logical formalism. This is not to say formalism serves no purpose. For example, it helps us to check whether our intuitions are correct, because sometimes our intuitions are wrong! It also helps us crystallize our ideas, in the same way that (non-mathematical) writing helps us clarify our thoughts.
I’ll argue an additional point. Sometimes, mathematical formalism helps us extend our intuition and create new ideas in a way that is otherwise difficult (or perhaps impossible). A high standard of formalism allows us to solidify intuitions into precise definitions which can be ported over to other settings. Here are some examples.
The analogue isoperimetric inequality in three dimensions is this: among all bounded, boundary-less surfaces of a fixed surface area, the one which maximizes the volume is a sphere. (Or said another way, among all such surfaces of a fixed volume, the one which minimizes the surface area is a sphere.)
This fact is physically manifested by water droplets, which equilibriate to a perfectly spherical shape under the force of surface tension, seeking to minimize their surface area. It might be easier to conceptualize this by adding an opposing force. In the presence of gravity and a planar surface, and the droplet deforms into a spherical cap due to the additional desire to minimize gravitational potential energy (i.e., the water molecules want to sit as low as possible). At smaller sizes, the tug-of-war between gravity and surface tension tilts in favor of the latter, while at larger sizes it tilts towards the former.
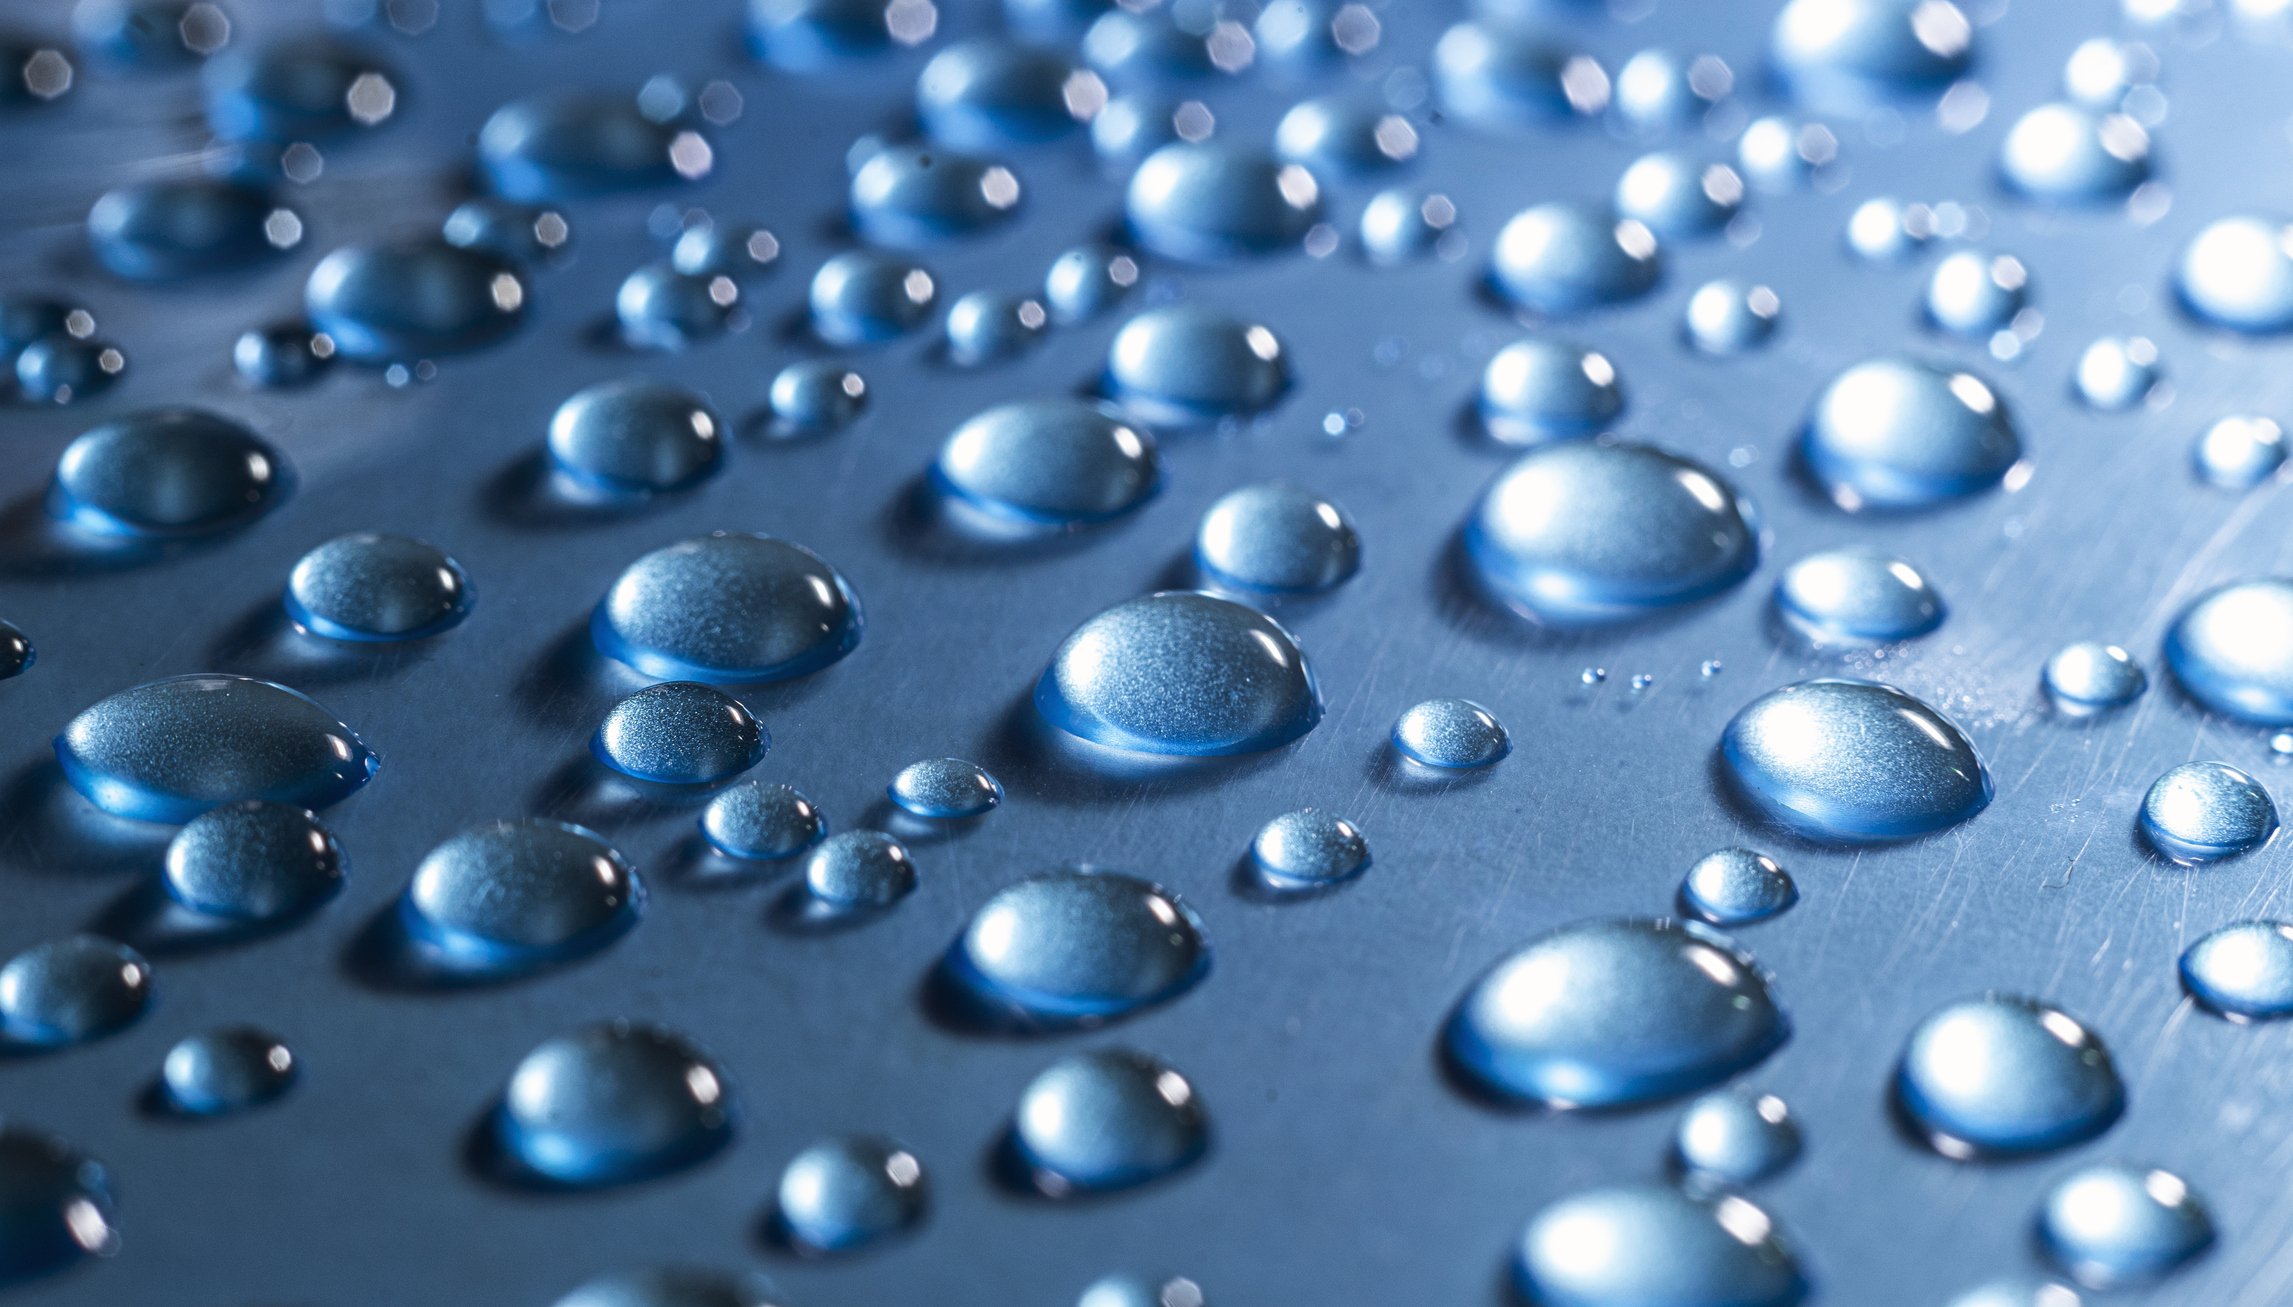
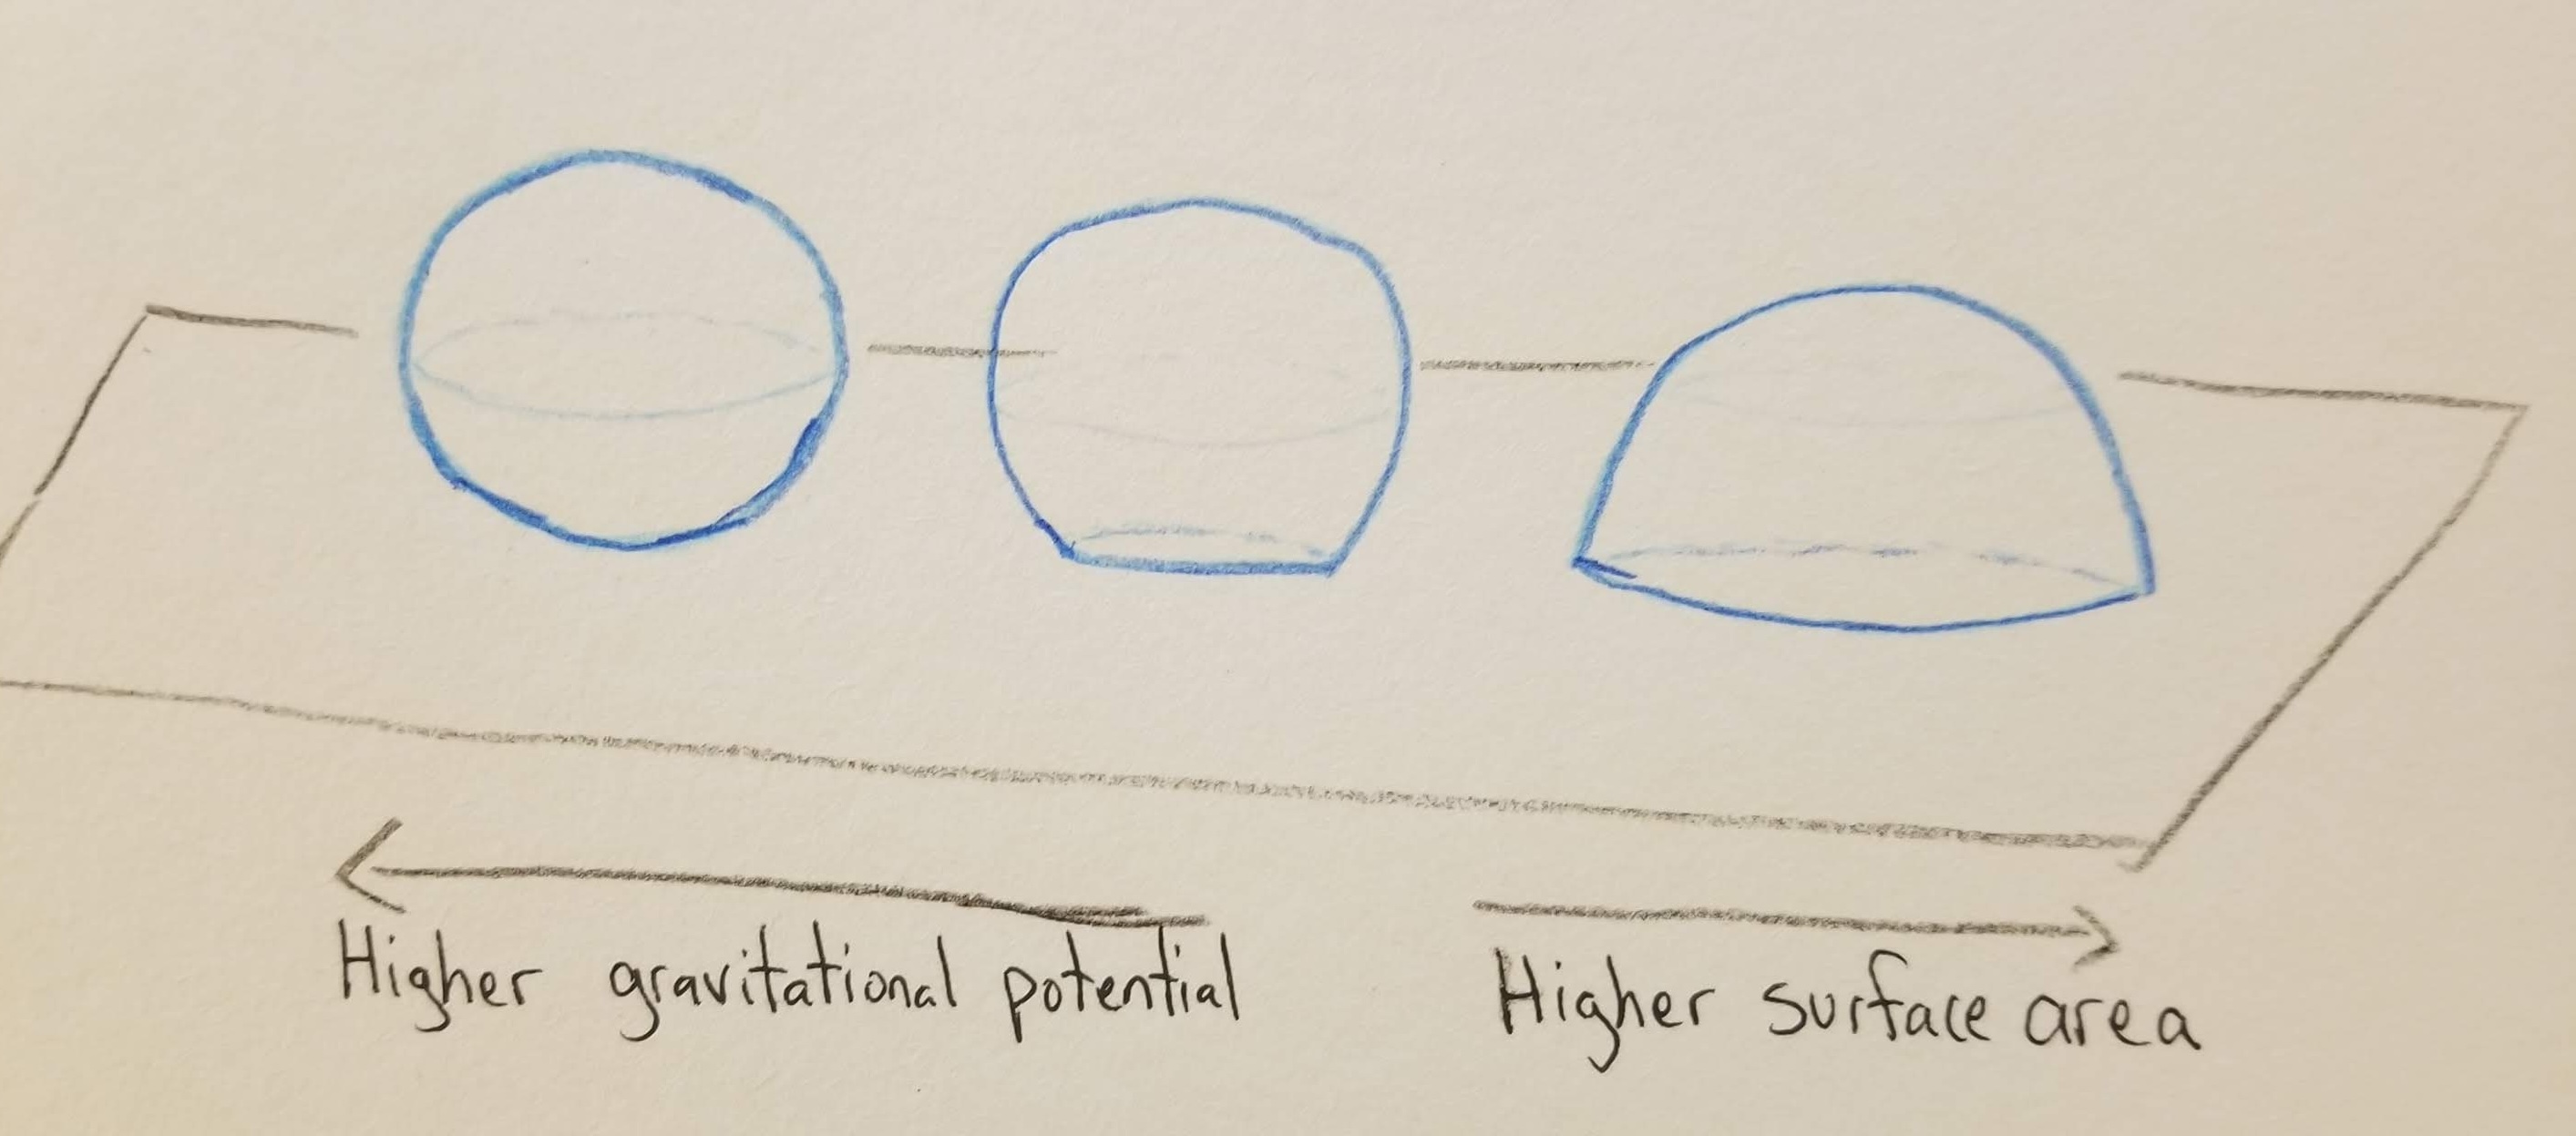
Image source: https://www.pnas.org/post/journal-club/droplets-converge-slippery-nature-inspired-surface
Another manifestation of the isoperimetric inequality in three dimensions is the fact that planets (large enough that there is only one dominant force acting upon them at scale, i.e. gravity between particles) are spherical. This connection goes back to Ptolemy!
It turns out that if we’re careful enough about our definitions in the proof of the two-dimensional isoperimetric inequality, then the same proof applies to three dimensions.2
A natural extension of these questions arises from observing soap films, which are two-dimensional surfaces constrained to hug a fixed one-dimensional boundary, and having minimal area. These so-called minimal surfaces have a rich and mathematically deep history, with many applications, but we can barely even talk about them clearly without defining curvature, which is one of the core ideas in the proof of the 2D isoperimetric inequality.
Finally, sometimes formalizing an “obvious” statement leads to new techniques of thinking, which then can let you deduce new statements which are totally non-obvious. Here’s an example of a non-obvious statement, which becomes clear once you have the right intuitions, and which you can develop from a different proof of the isoperimetric inequality.3
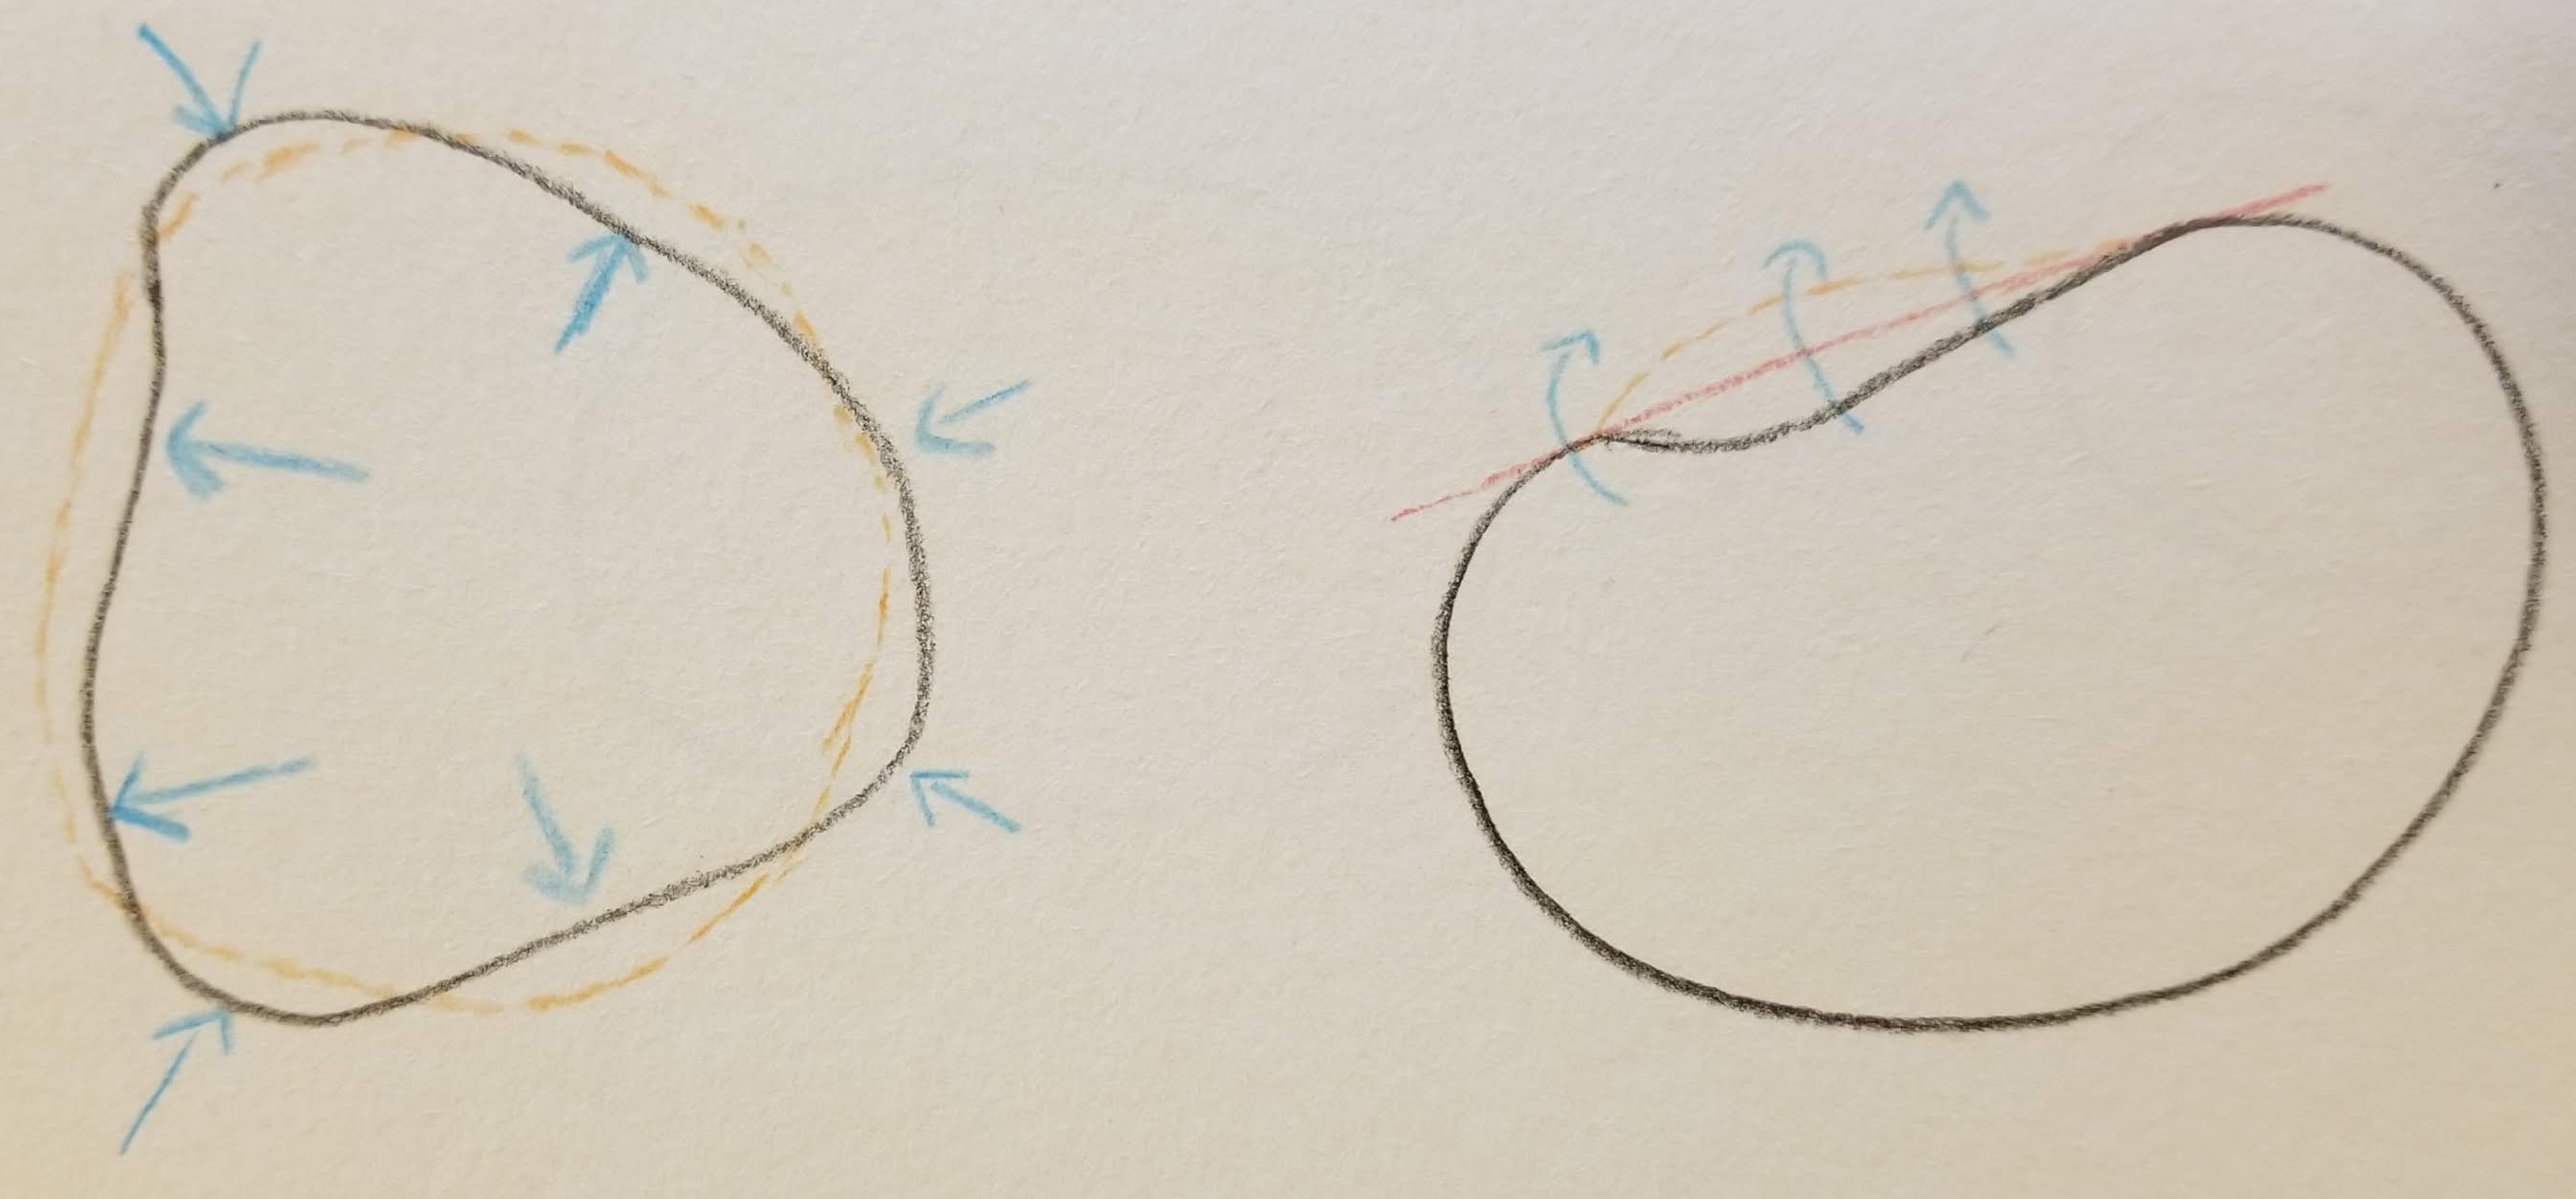
Consider a closed curve C in the plane. Place a segment of length 1 with both endpoints P and Q on the curve, and move P around the full length of the curve, letting Q follow so that Q always lies on the curve and the segment remains of length 1 the entire time (similar to two pins both on a fixed track, and connected by a rigid rod). Let C’ be the curve traced out by the midpoint of the segment PQ. Then the total area between C and C’ is , regardless of the choice of C.
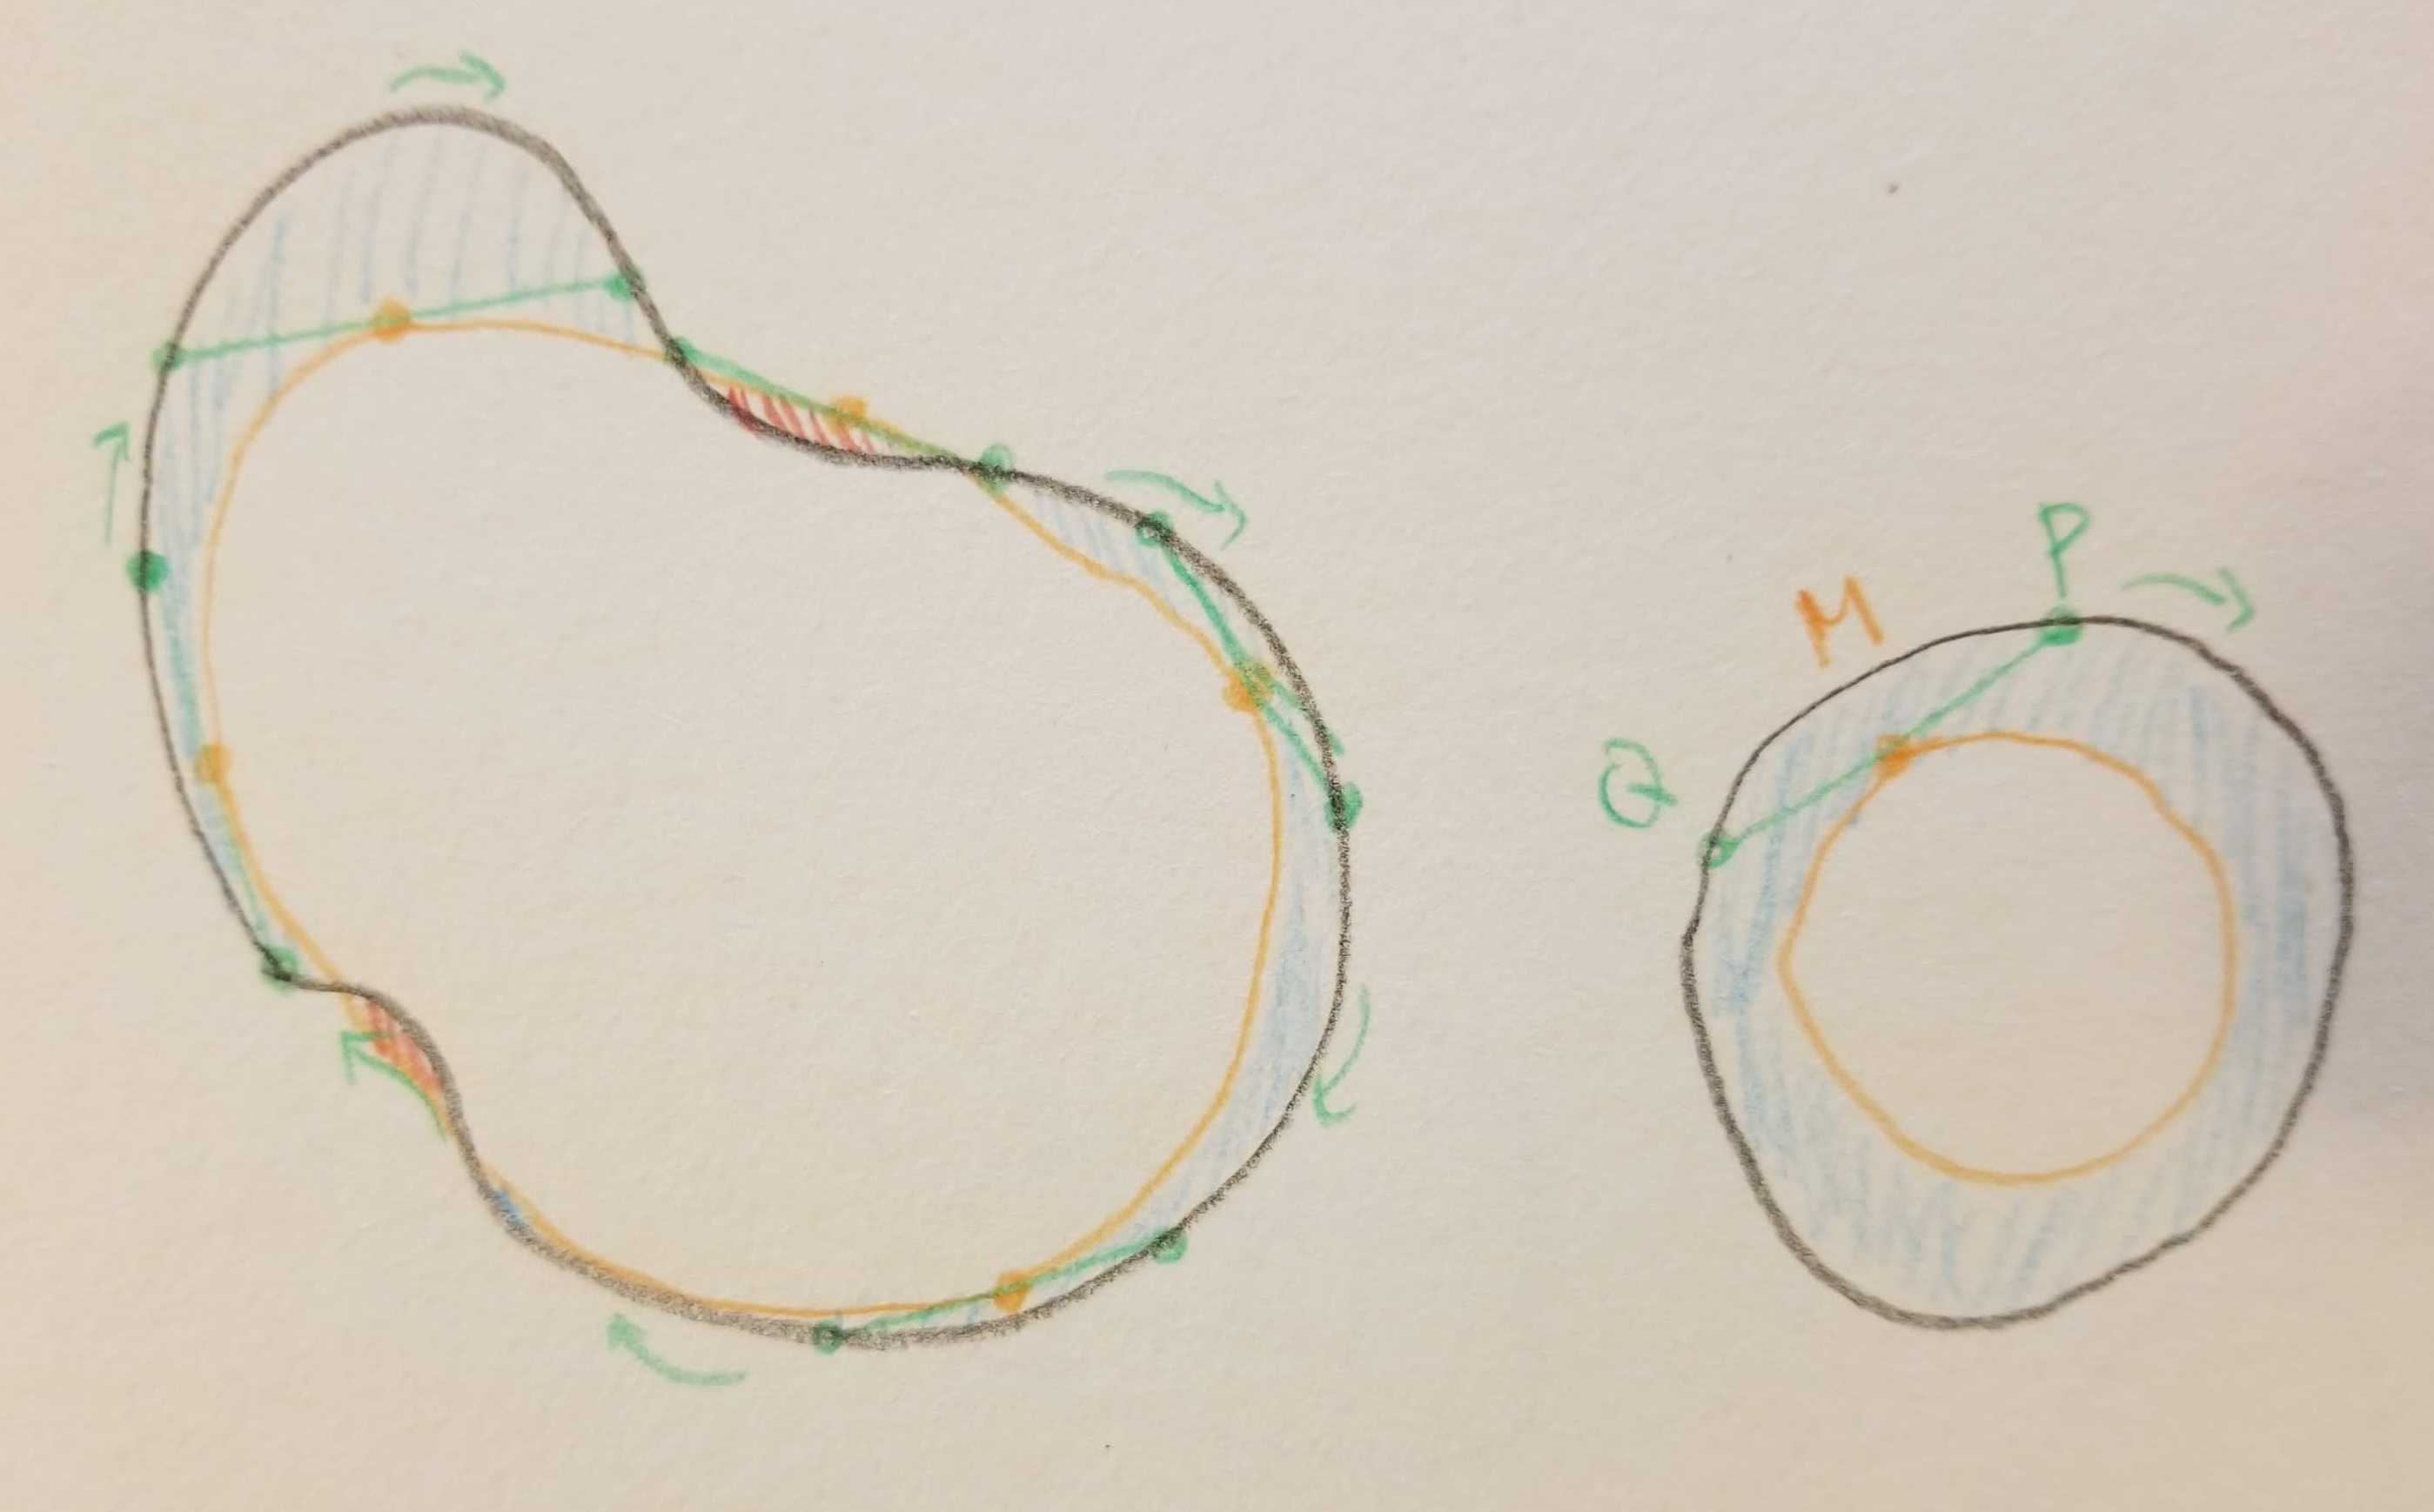
Two such curves C are shown above in black. The green segment has length 1 at all points along its path, and its midpoint (orange) traces out the curve C’ (drawn in orange). The area in question is shown in blue (with regions landing outside C shown in red, and counting negative). In both cases, it’ll have the same total value. I find this statement totally non-obvious, yet it’s actually easier to prove than the isoperimetric inequality — and falls within the same circle of ideas.
What is “curvature”?
The work in the proof of the isoperimetric inequality lies largely in nailing down the definition of curvature, and figuring out how this definition relates to arc-length and area. We want “the curvature of the curve at the point ” to be a number which captures how sharp the curve is at that point.4 A larger curvature value means more pointy, and a smaller one means more flat, with curvature 0 being a straight line.
There are two main ways to think about curvature. The first is geometric. Pick a circle which best approximates the curve at the point (called an osculating circle). If the circle lies inside the curve (i.e. the curve points outward), then the curvature is defined to be , where is the circle’s radius. If the circle lines outside the curve (i.e. the curve points inward), then the curvature is . Note that if the curve is itself a circle, then it is its own osculating circle at all points, so the curvature is constant everywhere.
The second is analytic. Imagine the curve as a road, and a driver traveling along the road in the counterclockwise direction, with a constant speed. At any time, the driver has a well-defined direction of travel, specified by an angle . The curvature is the rate at which this angle is changing precisely as the driver passes . That is, the curvature is how far to the left the driver’s wheels are turned.
To me, the first definition feels like it’s on shaky ground (what does “best approximation” mean?), while the second feels solid. But the first also feels more intuitive and easier to imagine. It’s helpful to have both pictures in your mind at once. It’s also helpful to think about why they describe the same number. The fact that these two describe the same thing is also captured by the fact that cars have a (minimum) “turn radius”.
Exercise: Show that for the second definition of curvature, a circle of radius has curvature at every point.
Now that we have a way to quantify curvature, it’s somewhat sensible to say “push the curve inward where the curvature is high, and push the curve outward where the curvature is low or negative”. But what effect does this have on the arc length and area of the curve?
A brief aside on calculus intuitions
I’ve taught calculus many times to university students. Grading their work always turned up shockingly basic algebra errors, such as or . I couldn’t understand how these errors occurred, and I thought the issue was a lack of careful practice with algebraic manipulation. Later, I realized the problem is not skill at symbolic manipulation — sometimes, people never understood the meaning behind the symbols (and yet were persistent enough to do it anyways). If you had the change to deeply learn the intuitions yourself in grade school, it’s very hard to imagine not seeing the meaning, and nearly impossible to imagine doing algebra without seeing the meaning (which is why I assumed algebra skills were the problem).
I think that calculus has a similar sort of issue. It’s placed as the “pinnacle” of high school mathematics, with algebra and precalculus as prerequisites. And those subjects are necessary background if you want to talk formally and rigorously about calculus. But the fundamental intuitions of the subject, which are about continuous change over time and smoothing/optimization, require no algebra. I often wonder if calculus ideas would be better placed far earlier in the math curriculum, alongside the beginnings of algebra.
By the time students reach the end of high school, they’re so used to pushing symbols around and calculating, that it is difficult to let go and imbibe a new way of thinking. That’s what’s necessary to really reason about this next step — you’ll have to squint your eyes and loosely imagine with pictures for a moment.
“Squishing” the curve
Next, we return to the question of “pushing out” the parts of the curve with low curvature. Let’s suppose that we have a portion of the curve with some length and radius of curvature (meaning that the curvature value is ). And let’s suppose that we push this section of the curve outwards by a small distance . How do the arc-length and enclosed area change under this operation?
Some simple circle geometry will tell you that the angle of the arc is equal to radians, which means that after pushing the arc outwards by , its length will be , meaning that the arc length increased by . And the additional area enclosed will be the increased area of the circular sector, i.e. . If we imagine to be very small in comparison to (i.e. we push outward an infinitesimal amount), then the area increases by . Summarizing,
In other words, when we push a section of curve outwards, the area increases at a rate proportional to the length of curve being pushed, while the arc-length increases at a rate proportional to the length of curve times the curvature.
With this calculation-based insight in mind, let me rewrite the “intuitive strategy” we described before:
If there’s one part of the curve which is sharper than the rest of the curve, you can squish that part inward and push the flatter parts of the curve outward, and this increases the area.
We can quantify this more clearly. If one part of the curve has higher curvature than another, you can define a deformation with variable value of over the entire curve, where
- is positive in the lower-curvature regions,
- is negative in the higher-curvature regions, and
- has overall average value zero.
Since the overall average value of is zero, the area won’t change, but the arc-length will decrease because the negative values of are amplified more than the positive values of .
Finally, after a deformation which leaves area constant and decreases arc-length, we can scale up the entire curve to its original arc-length and will get a larger total enclosed area than before. This means that the curve we started with wasn’t optimal.
Proof of the isoperimetric inequality
The proof of the isometric inequality is just a rigorous formulation of the previous section, which I write here for completeness. This uses the calculus of variations. I hope that having the preceding pictures in mind will make this a far easier read than it was before!
Let’s assume our curve has total arc length and area . Let be a parameter which denotes the position along the curve. Let be the vector coordinates of the point at position , let denote the (outward-pointing) normal vector to the curve at position , and let denote the curvature at position .
Let be a function and a number, both of which we’ll specify in a moment. Consider applying a deformation to every point on the curve which sends to . Let and denote the length and area of the resulting curve after this deformation. Then
Suppose that is not constant-valued. All we need to do is to construct a function such that the second integral above equals zero, and the first integral is negative. It suffices to pick
where is the average curvature. That is is equal to the average curvature minus the curvature at . The second integral evaluates to zero because has average value zero. To show that the first integral is negative, we need to show that
This follows from the Cauchy-Schwarz inequality, because the left side is and the right side is . (Another way to see this is that the function is more correlated with itself than it is correlated with a constant function.)
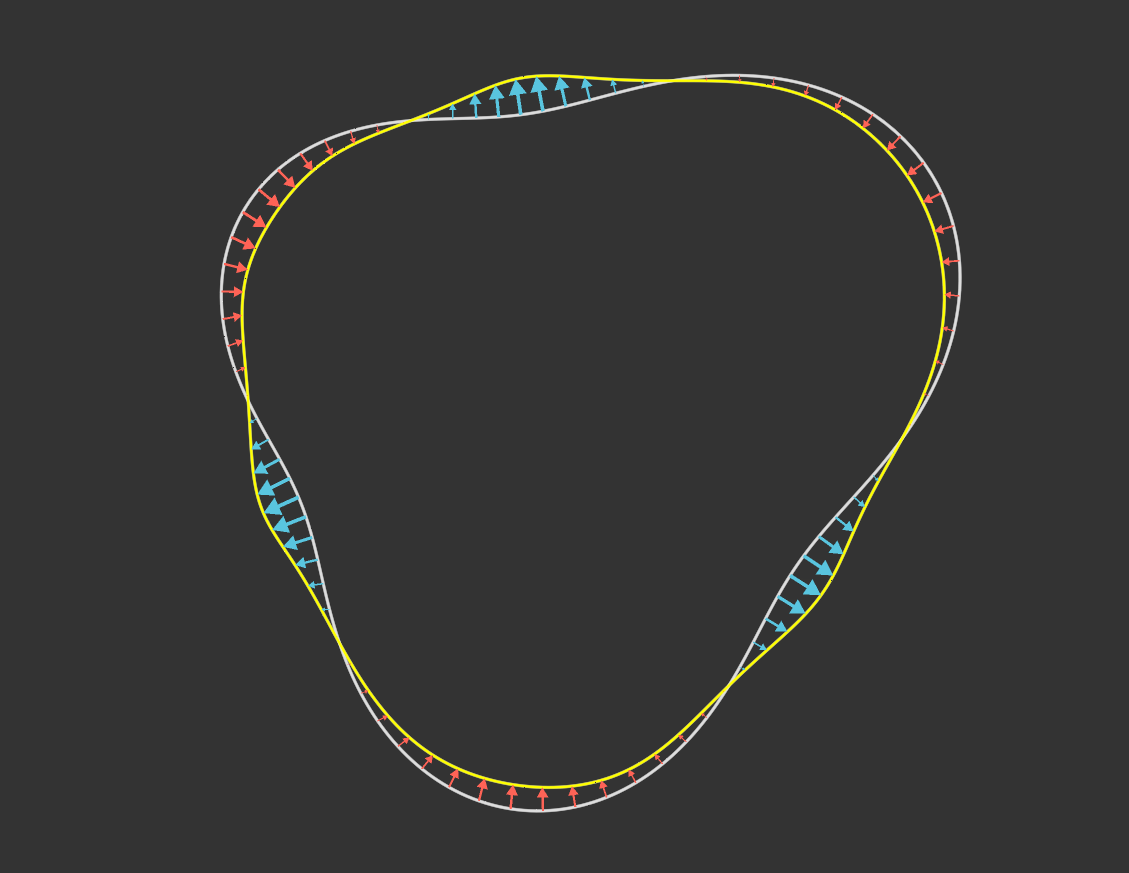
Below is an animation of this process, along with the changing perimeter and area.
Comments and generalizations
I want to close out with some brief words about where this leads5, and what we can take away.
First, I want to consider the isoperimetric inequality in higher dimensions. How would “curvature” be defined in the three-dimensional case? It turns out there are multiple possible ways. However, the proof we just discussed indicates one way we “should” define curvature. Namely, we “want” define curvature so that the following property holds:
If a surface has curvature at a point, then a small perturbation of magnitude to a small patch of surface area , in a direction normal to the surface, leads to an increase of the surface area by (analogous to the formula for perimeter in the two-dimensional case). For such a definition of curvature, it’ll then follow that the largest volume you can achieve with a fixed amount of surface area is given by a surface with constant curvature.
So you can start poking around with different ways of defining the curvature of a surface to make the above property holds true. It turns out that this calculation property is satisfied by the mean curvature, which is basically given by drawing two intersecting orthogonal curves on the surface, calculating their two curvatures and taking the average. The proof of the isoperimetric inequality gives a toehold from which you can come to this new definition (and the subject of differential geometry) with an intuition to build off of.
There’s more. Surfaces with a boundary (such as soap films) which have zero mean curvature everywhere are called minimal surfaces. This isn’t my area of expertise, but from what I understand minimal surfaces are very important, a cornerstone topic in geometry and prevalent in applications outside of mathematics.
Why are they called “minimal surfaces”? It’s because they minimize surface area, subject to the boundary constraint. If you’ve really internalized the proof of the isoperimetric inequality, then may even seem intuitive to you — if a surface doesn’t have zero mean curvature, then you can “squish” it according to the same method we used in the two-dimensional case and thus reduce its surface area.
This shows another tool that practitioners of mathematics use: understanding complex cases by analogy to simple ones. Often the cornerstone strategy to understanding difficult mathematics is this: to build a deep intuition for so-called “simple” parts. I think Bill Thurston put it well (from the oft-quoted Math Overflow post): “The world does not suffer from an oversupply of clarity and understanding (to put it mildly).”
- I wonder if this proof should still be presented to young students, before they’re bogged down by all the delicate maneuvers of manipulating integrals and while they still think imaginatively. ↩︎
- With a caveat. This is jumping ahead, but the proof technique employed here will tell us that the surface with maximal volume for a given fixed surface area, has constant mean curvature. In two dimensions, it is essentially a one-line step to get from here to a circle, but in three dimensions this is actually a challenging theorem of Liebmann from 1900. This is why the theorem of minimal surfaces is so rich, while the minimal curve connecting two points is always just a line. ↩︎
- The key line of reasoning comes from parametrizing the x- and y-coordinate of a variable point on the curve, and then expressing areas as inner products of these functions. The concepts are similar to those used in the Wirtinger’s inequality-based proof of the Isoperimetric inequality, also shown near the beginning of Osserman’s paper. ↩︎
- For the sake of simplicity, I’m going to assume the curve is smooth, which implies that the curvature is well-defined and continuous. ↩︎
- The theory of minimal surfaces is as far from my original area of expertise as possible, which is why this list is so brief. The positive side of this is that I come with fresh eyes and the joy of learning for the first time, so hopefully I turn can turn up more to write about. ↩︎